TF2 Unusual Effect vs Crate Series
Information
This page is compiled manually through data gathered from "May 2012 Item Statistics"Summary
Unusual Effect is related to the Series of the Crate unboxed.
Based on 3.5 million items from Crates and 25 thousand unusuals, produced between August 2011 and May 2012.
Definition
- original_id roughtly represents time. Greater number means more recent. original_id never changes, even after trading.
- Old effects refer to Unusual particle effects existed before the August 18, 2011 Patch, namely Green Confetti, Purple Confetti, Haunted Ghosts, Green Energy, Purple Energy, Circling TF Logo, Massed Flies, Burning Flames, Scorching Flames, Searing Plasma, Vivid Plasma, Sunbeams, Circling Peace Sign, Circling Heart.
- New effects refer to Unusual particle effects introduced at the August 18, 2011 Patch, namely Bubbling, Steaming, Orbiting Fire, Orbiting Planets, Nuts n' Bolts, Smoking, Stormy Storm, Blizzardy Storm.
- Old crates refer to crates retired on or before the August 18, 2011 Patch, namely Series #1 to #25.
- New crates refer to crates released on or after the August 18, 2011 Patch, namely Series #26 to #45 (Data is from May 2012).
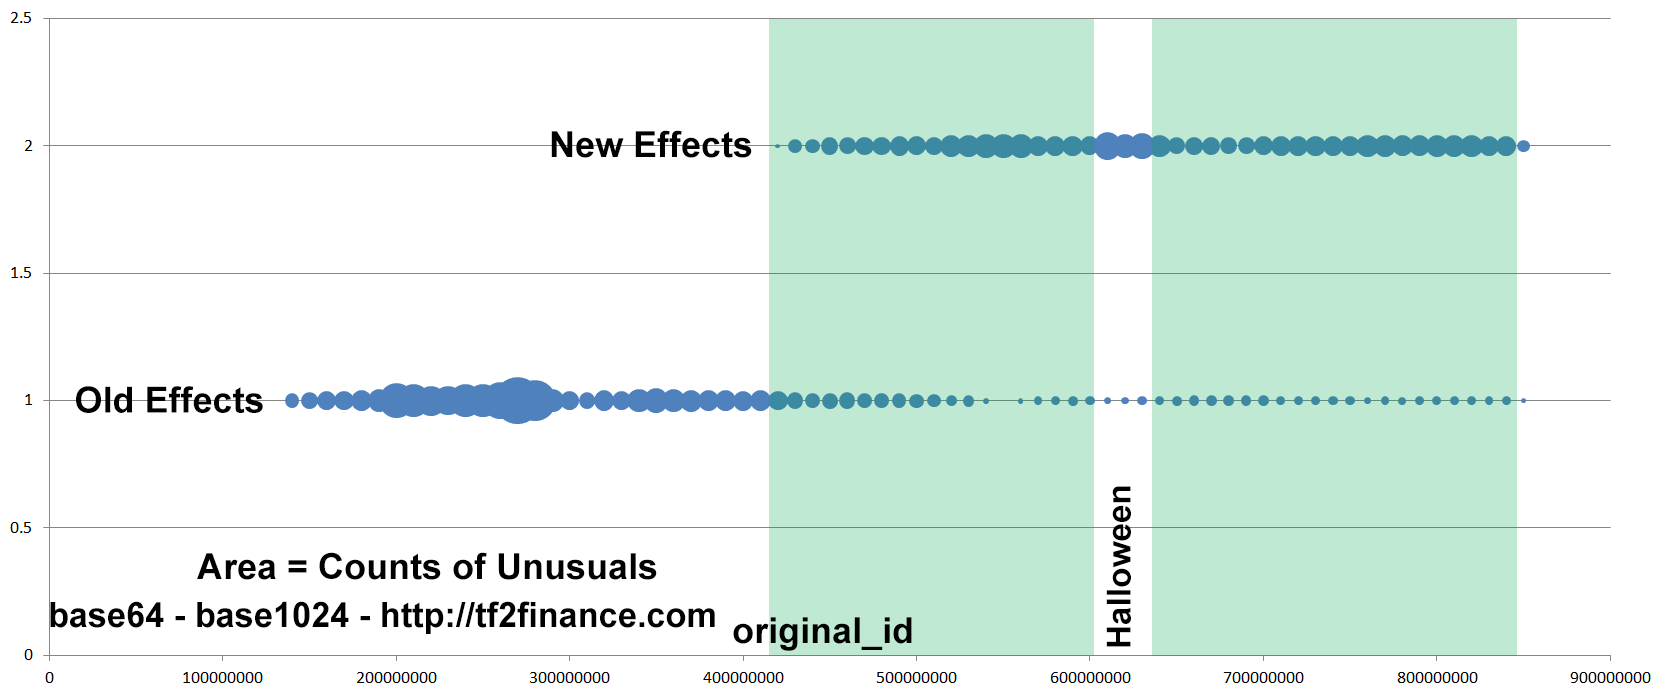
Known fact #1: More new effects are produced than old effects nowadays
Based on Historical Data before May 2012.
The larger the circle, the more Unusuals were produced.
We can see that the production of old effects gradually decreases over time, while the production of new effects spikes whenever new series are released or an event takes place, e.g. Christmas.
For recent approximated data, please examine http://stats.tf/particles
For conversion between original_id and actual date, please examine the table at http://tf2finance.com/rate/
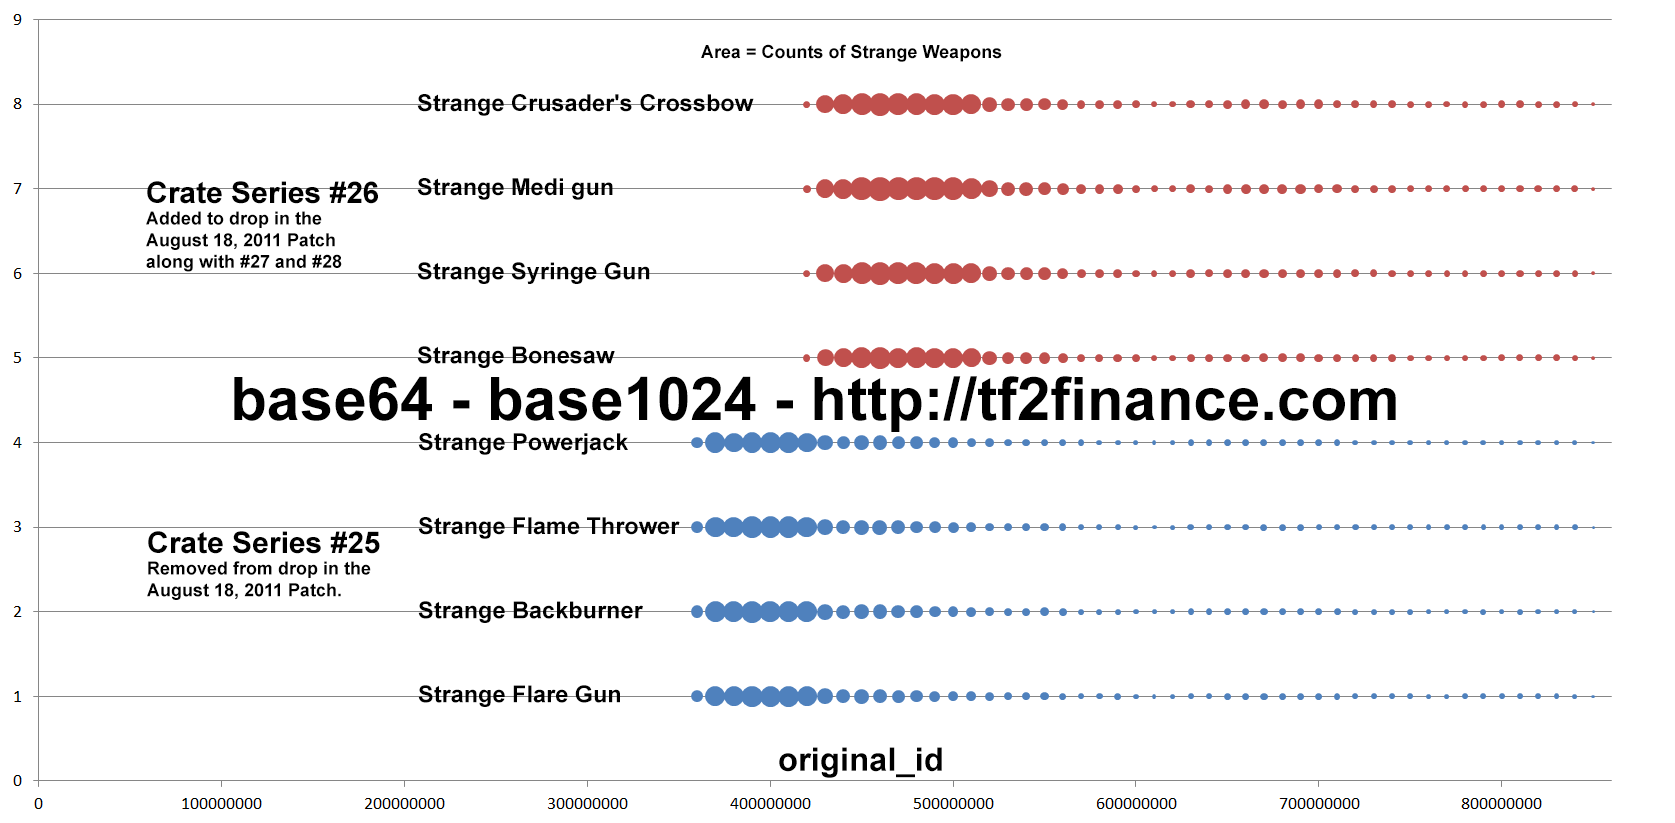
Known fact #2: People tend to unbox newly released crates
In this example, once Crate #26 is released, people immediately unboxed far less Crate #25.
After a while, the production activity of Strange items from Crate #25 and #26 becomes identical.
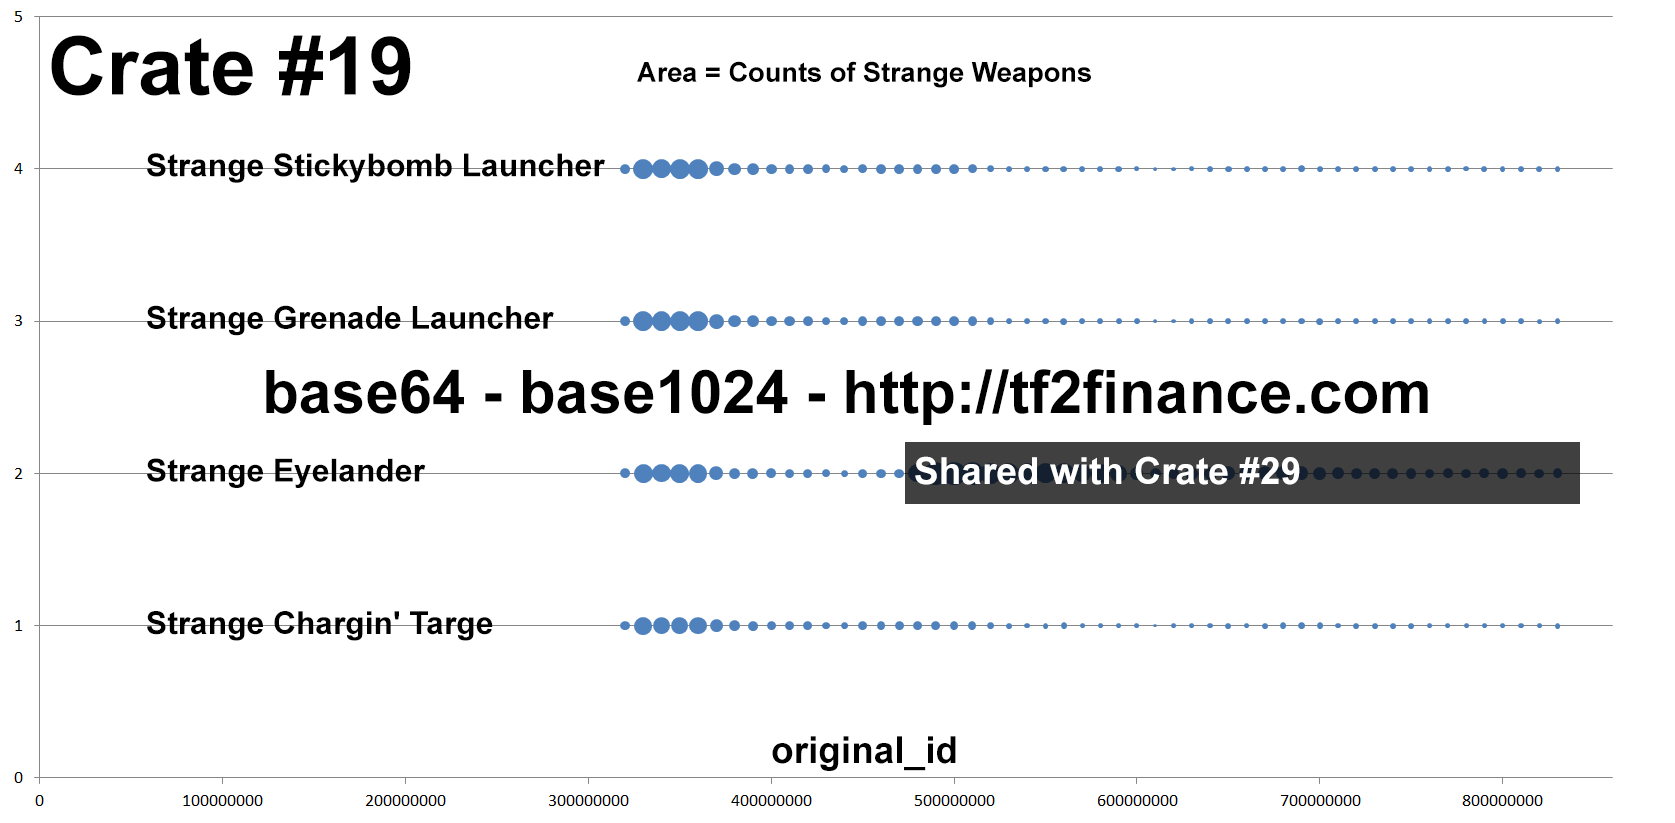
Known fact #3: People do not dramatically "revive" a specific old series
In this example, Crate #19 is widely known for high average return on unboxing, but its "production activity" is very consistent over time.
Observation: Unboxing activity of New/Old Crates correlates production of New/Old Effects
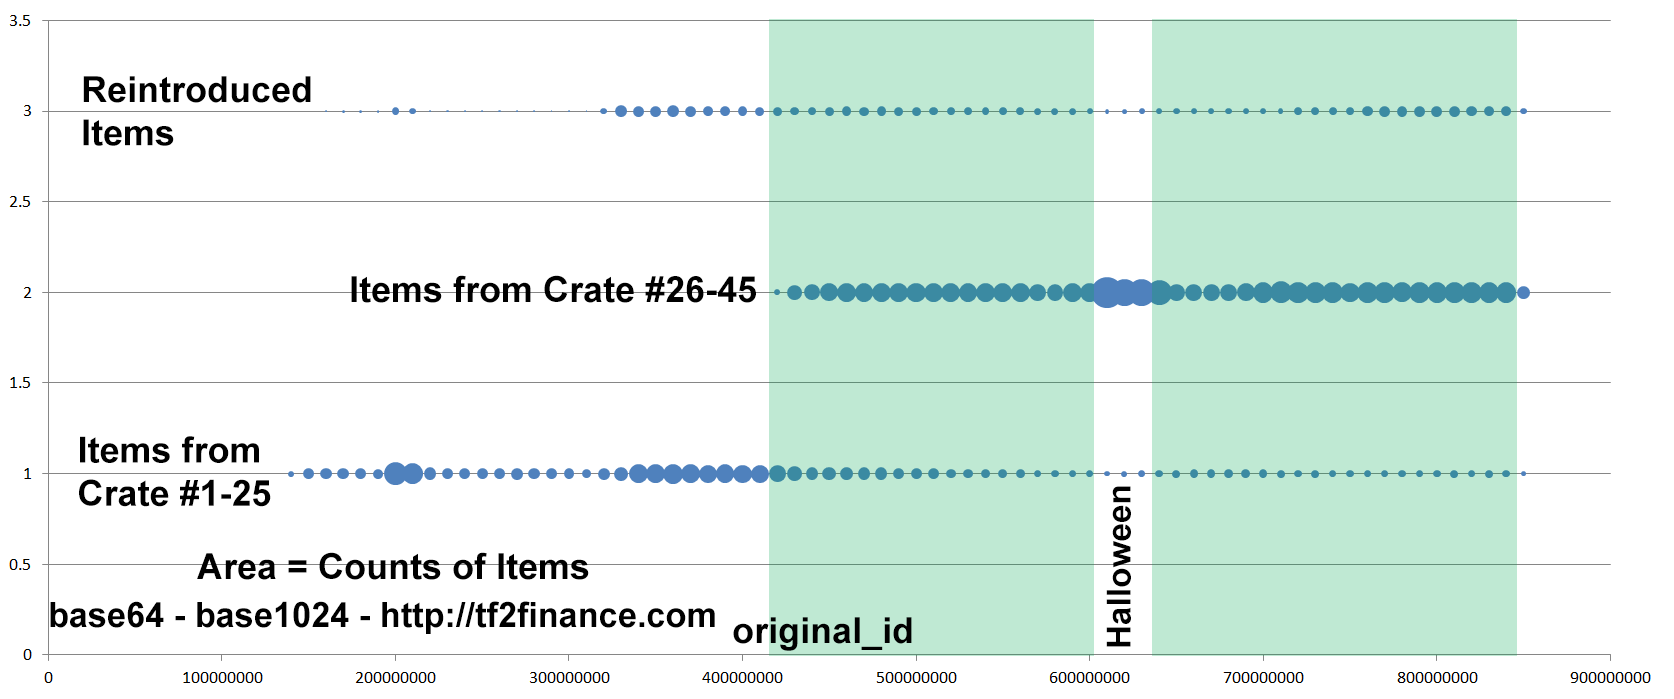
Method: Examine correlation between two Ratios of production figures, per fixed time interval.
| Ratio X | Ratio Y |
| (Items from New Crates ÷ Items from Old Crates) | (Unusuals with New Effect ÷ Unusuals with Old Effect) |

For interpretation, please read Pearson product-moment correlation coefficient
Strange Weapons, Hats, Unused Paints, Unused Tags, Unused Strange Parts from unboxing, grouped by New/Old crate series and original_id (time)
Unusuals from unboxing, grouped by New/Old particle effect and original_id (time)
Raw data
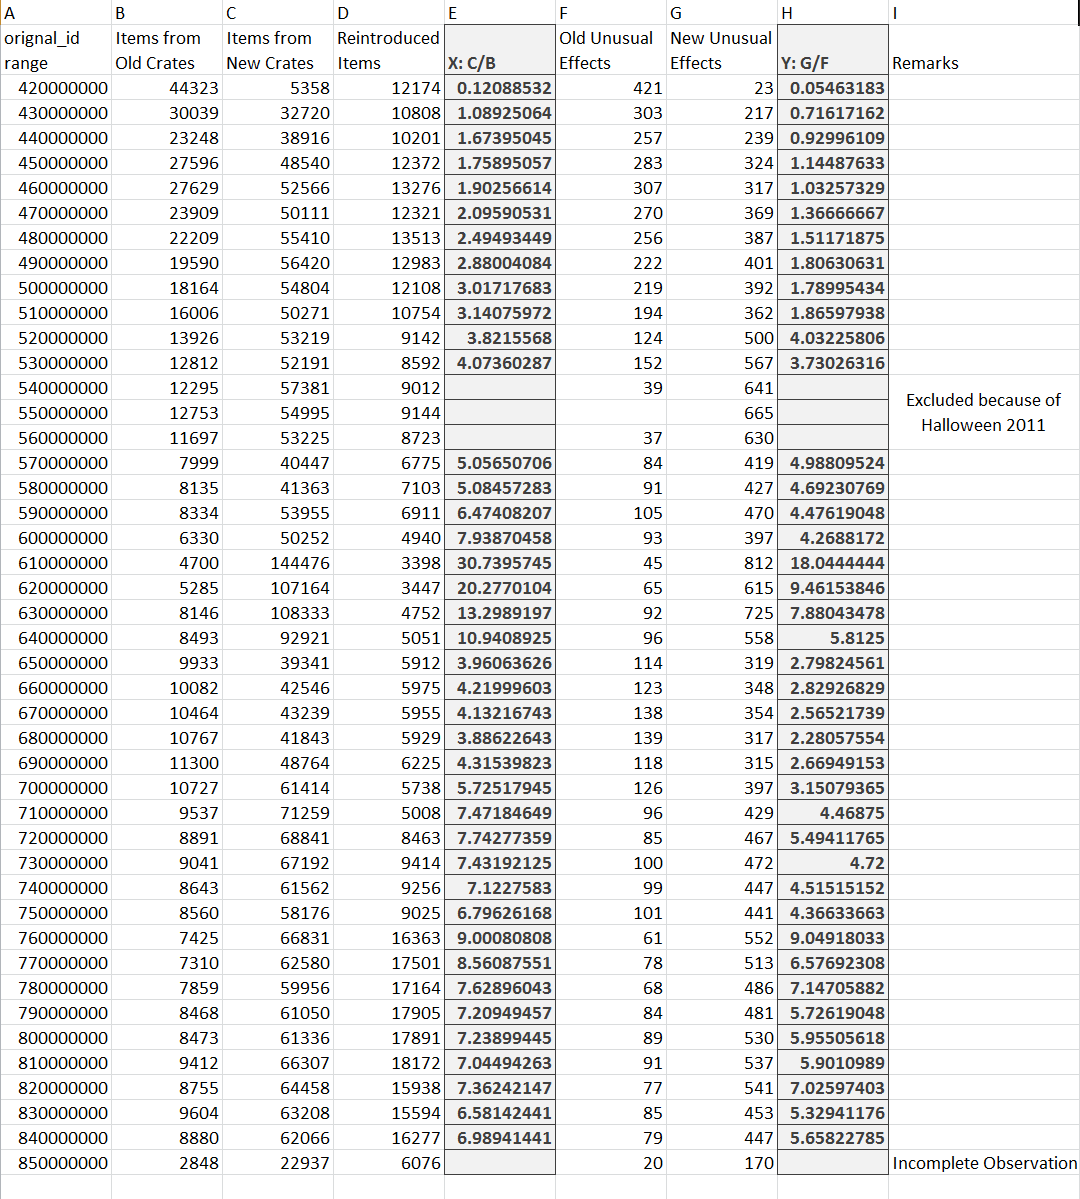
Finding: Unusual effect is strongly correlated with crate series (New/Old)
By definition, correlation coefficient of 0 implies No Correlation, while -1 or 1 represents exact correlation.
A correlation coefficient of >0.9 represents "very high correlation".
Hypothesis #1: New Effects can only come from New Crates;
Old Effects can only come from Old Crates.
If this hypothesis is confirmed, the slope of the regression line should be 1.00 instead of 0.6375.
For example, we expect that if we uncrate 40% more new crates, we will have 40% more new effects, while holding old effects and crates constant. Thus Slope = 1.40/1.40 = 1
Given that some old crates only contain Paints, if we arbitrarily assume that 33% of Items from of Old Crates are already consumed by May 2012, we can apply a "correction for consumed items" with a scalar factor of x1.5 on Column B of the Raw Data.
* 1.5 x 0.33 = 0.5 ; 0.5/1.5 = 0.33
However, there is currently no way to find out the exact proportion of consumed items.
Regression after apply x1.5 factor on Items from Old Crates
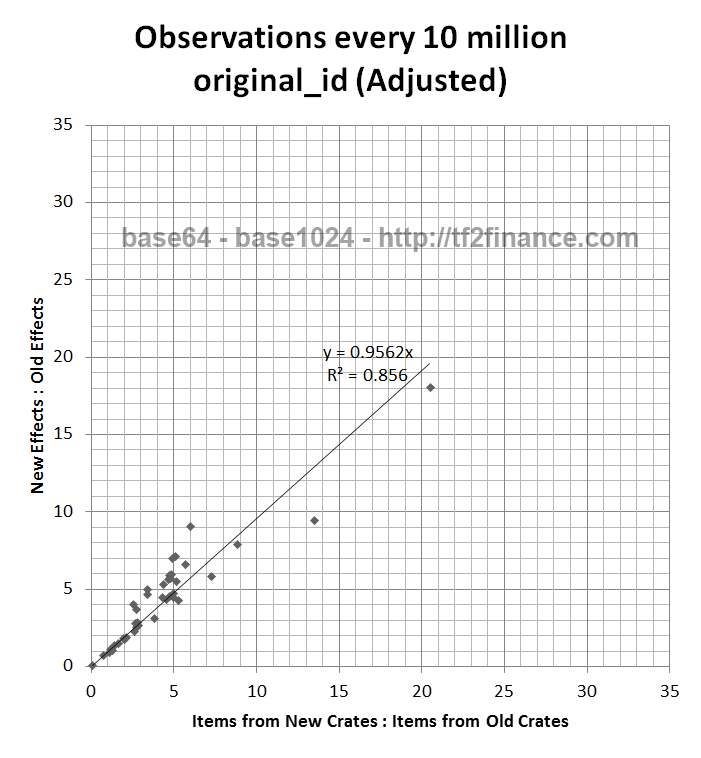
(Alternate) Hypothesis #2: Unusual Effects can come from any series, but the probability of New Effects changes according to how many New/Old Crates were globally unboxed in current/last period.
Given that the slope of the regression line is close to 0.66 without any adjustments,
P(New Effect | Unboxed an Unusual) =

if this Hypothesis is confirmed.
(Dismissed) Hypothesis #3: Old Crates only contain Old Effects,
while New Crates contain 80% New Effects and 20% Old Effects
Thus giving Y = 0.66 = 4:6 when X = 1:1
Example: Unusual Rate is 1%. 500 New Crates and 500 Old Crates were unboxed.
5 Unusuals came from the 500 New Crates, of which 80% are New Effects and 20% are Old Effects, i.e. 4 New Effects and 1 Old Effect.
5 Unusuals came from the 500 Old Crates, of which 100% are Old Effects, i.e. 5 Old Effects.
X = New Crate / Old Crate = 500/500 = 1.00
Y = New Effect / Old Effect = 4/(5+1) = 4/6 = 0.66...
Thus (X, Y) = (1, 0.66...) is a point on the scatter plot.
However, when X = 10:1, Y = 40/15 = 2.66 instead of 10 x 0.66 = 6.66.
This hypothesis suggests a non-linear relationship between two Ratios, and the raw data only supports linear relationship, especially the points at the 45 degree line.
Any hypothesis on either Crate containing a fixed ratio of both Old and New Effects is not supported. The expected value of Y converges to a small value as X increases when the relationship is non-linear.
Therefore, it is unlikely that this hypothesis can be confirmed.
Randomness within Old Effects after 2011 Halloween
No conclusions yet.

Conclusion
Unbox more Crate #1 to #25 if you want the market to have more Old Effects.
Currently, an Unusual with New Effect is only worth 40% of an Unusual with Old Effect on average (http://tf2finance.com/unusuals/).
Hypothesis #1 and Hypothesis #2 are mutually exclusive.
To disprove "Old Crates = Old Effects; New Crates = New Effects (Hypothesis #1)", only ONE counterexample of unboxing is needed from Youtube: By showing an Old Effect from a New Crate, or a New Effect from an Old Crate.
Further Reading
http://wiki.teamfortress.com/wiki/Unusual
News (April 5, 2013) |

